Location, Location, Location Why Leatherback Populations Vary Globally

Ecosystem stability (based on variability in sea-surface temperatures) in leatherback foraging areas worldwide varies from very stable areas (cool colors; e.g., the western Atlantic Ocean) to highly unstable areas (warm colors; e.g., the eastern Pacific Ocean). General foraging areas of the respective leatherback populations are highlighted on the basis of satellite tracking studies. © Vincent Saba
By Vincent Saba and Bryan Wallace
Sea turtle researchers are often asked seemingly simple questions: How much do leatherbacks weigh? How many eggs do they lay? Are their numbers declining, and will they become extinct? Research has revealed that the answer to each of those age-old queries for leatherbacks is consistent: it depends.
It turns out that the answers to many questions about sea turtle biology depend on your location in the world. For example, leatherbacks are Critically Endangered globally according to the 2008 IUCN [International Union for Conservation of Nature] Red List of Threatened Species™. However, populations in some regions appear stable and are even growing, while in other regions they have crashed. Sea turtle researchers must continue to focus their work at more specific scales that will provide insight into the geographic differences among turtle populations to help guide and prioritize global conservation efforts.
Although leatherbacks worldwide belong to a single species genetically, individuals and populations can vary remarkably in morphological, reproductive, and behavioral traits. Leatherbacks in the eastern Pacific Ocean (EP) have the smallest body sizes, lowest number of eggs per clutch, and longest interval between nesting seasons of any leatherback population globally. In addition to those life history differences, EP nesting numbers have declined by more than 90 percent in the past two decades, whereas leatherback populations in other ocean basins are stable or are increasing (see graphic in PDF version of this article). The fact that populations in different ocean basins show such marked differences in both life history and population trends hints at important, large-scale differences in leatherback habitats around the world.
Analyses of energy requirements for egg-laying indicate that EP leatherbacks appear to be resource limited with respect to their counterparts in the western Atlantic Ocean (WA). Despite having higher energy requirements than EP leatherbacks, WA leatherbacks remigrate to their nesting beaches twice as frequently, suggesting that leatherback food (jellies) is more consistently available and is in higher abundance in WA foraging areas than in EP foraging areas. If more food energy is available to WA leatherbacks, they should have bigger bodies, more eggs, and more frequent reproduction than do resource-limited EP leatherbacks.
To investigate this idea further, scientists analyzed net primary productivity (NPP) in leatherback foraging areas worldwide. Those analyses revealed that the amount and predictability of resources is indeed related to the average body size and reproductive output of leatherbacks from different populations. The highest variability in resource availability occurs in the EP, meaning that EP leatherbacks must forage for longer periods of time and probably over longer distances to meet their energy requirements, which most likely results in smaller body sizes and lower reproductive output. In contrast, leatherback populations with the largest body sizes and highest reproductive outputs tend to forage in areas characterized by stable, high levels of NPP, such as in the north Atlantic Ocean.
Imagine foraging areas as leatherback “restaurants.” Restaurants in the WA are generally plentiful, are open at the same locations every year, and serve lots of good food. However, restaurants in the EP tend to change location frequently, they are far apart, and the menu quite often is limited to daily specials. Thus, it’s tougher for leatherbacks to find a good meal in the EP, and they spend a lot of fuel searching for a place that’s open.
In addition to ecosystem factors, anthropogenic pressures can also impact the number of turtles in the oceans. Leatherbacks in the WA have shown clear signs of stability and even exponential increase, owing to beach conservation as well as high survival rates of adult turtles. Leatherback rookeries in the EP, however, have not yet shown signs of recovery, although conservation programs have been in place for more than 20 years at the major nesting beaches. Researchers now think that resource limitation not only renders EP leatherbacks unable to match the size and reproductive abilities of other leatherbacks, but also makes the EP population less resilient to high levels of human-induced mortality from hazards such as fisheries bycatch and egg collection. It is likely that the combined effects of high variation in NPP and human pressures in the EP have caused drastic population declines in recent decades.
Changes in ocean conditions over multiple decades also appear to influence leatherback feeding areas. Ocean temperatures shift in response to changing climate conditions over periods of 20 to 30 years. When the surface waters of the EP are cooler than usual, NPP is higher and favors good leatherback foraging. However, the opposite is true when surface waters are warm. The limited reproduction and the declining trend in nesting leatherbacks in the EP over the past 20 to 30 years have coincided with an unusually warm regime in the EP. Therefore, it is possible that when the EP is in a cool regime lasting multiple decades, leatherbacks may also become larger and more productive like their WA counterparts because foraging areas would be highly and more consistently productive. In addition, the EP leatherback population’s vulnerability to anthropogenic hazards would probably be lower during a cool phase in the EP, which would help the population to grow. Many aspects of the links between environmental variability and leatherback biology remain speculative, which further highlights the importance of long-term monitoring of both leatherback populations, and of changes in ocean conditions.
Understanding these links is important for setting conservation priorities for globally distributed sea turtle species. Until now, sea turtle status has been assessed for each species at the global level using IUCN Red List criteria that recommend projecting recent population trends into the past to estimate the degree of population change over three generations. However, sea turtle researchers have long recognized that global assessments fail to capture the idiosyncrasies of different populations of the same species and, thus, are unable to provide solid recommendations for regional conservation strategies. Considering the observed differences among leatherback populations described here, the IUCN will use a different approach in its forthcoming leatherback Red List assessment that will determine the conservation status of leatherback populations on regional and global scales.
Although it is unclear whether any new leatherback restaurants can be opened in the EP to help hungry turtles find more reliable meals, such improvements in the assessment procedure will help to target conservation actions to address the different scenarios that leatherback populations face around the world.
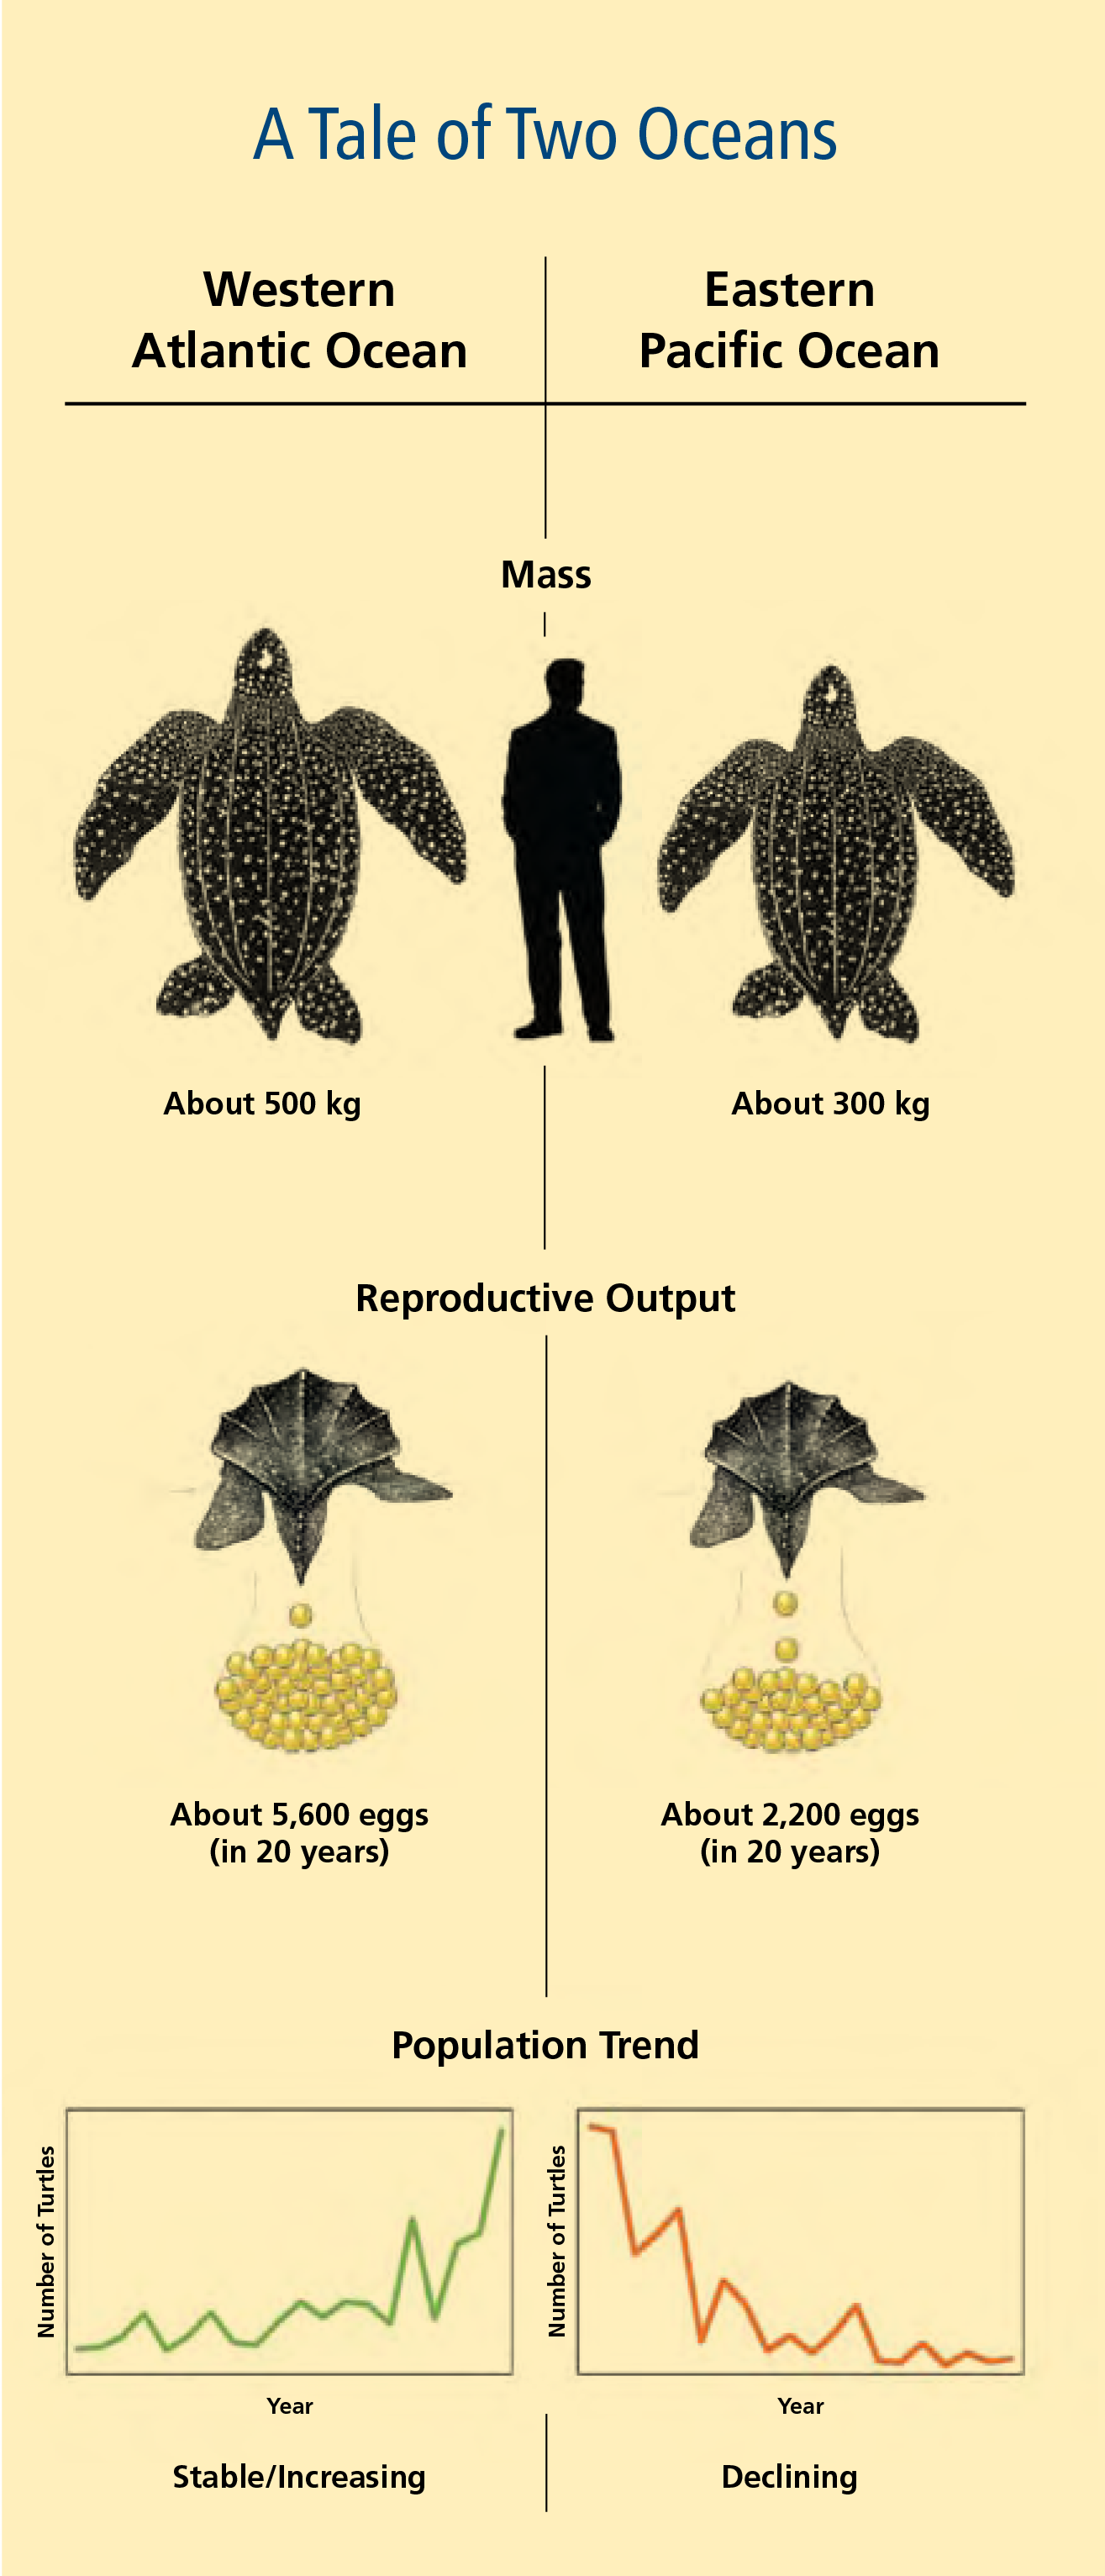
Biological traits of leatherback turtles vary according to where they are in the world. Leatherbacks that feed and breed in the eastern Pacific Ocean are smaller in body size and lay fewer eggs over time (through smaller clutch sizes and longer intervals between nesting seasons) than leatherbacks in the western Atlantic Ocean. Leatherback nesting populations in the eastern Pacific have declined precipitously in recent years, while many western Atlantic nesting populations are stable or increasing. Differences in resource availability between leatherback feeding areas in the western Atlantic Ocean versus the eastern Pacific Ocean appear to be driving this distinct pattern. Illustrations by Stephen Nash and Tom McFarland. Graphic by Brian J. Hutchinson.
This article originally appeared in SWOT Report, vol. 4 (2009). Click here to download the entire article as a PDF.